It was a bad day for metal stocks as the S&P BSE Metal index plunged 300 points (4.33%) to close at 6,647.17. On February 1, 2016 the market had closed at 6947.69. Today’s high and low points were 6,995.17 and 6,617.52 respectively.
Global markets indices such as CAC, DAX and FTSE as well as the Indian Sensex all closed in the red on February 2. The Sensex lost 285 points (1.15%) to close at 24,539.
Metals was the worst hit sector today. Each and every stock closed in the red. Vedanta was the top loser in this space. The stock crashed 7.8% to Rs 64.90. SAIL, Tata Steel, Jindal Steel, JSW Steel and HINDALCO were also among the losers, down in the range of 3.5-7.8%.
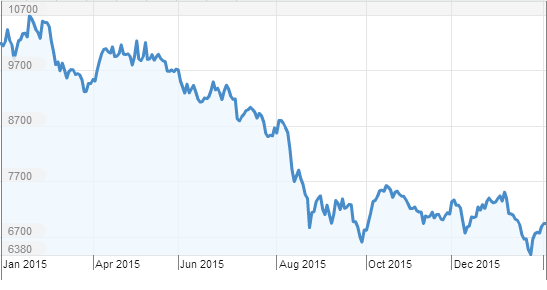
The movement of S&P BSE Metal for the last one year.
Heavy and light commercial vehicles sales increased 30% and 12% respectively while wholesale passenger cars decreased 20% in January year-on-year.
Overall, commercial vehicles sales for Tata Motors in the domestic market stood at 30,670 units in January 2016, an increase of 20%, compared to 25,587 units in January in the previous year. On the other hand, the company sold 9,350 passenger vehicles, lower by 20% compared to 11,637 vehicles sold in January last year.
Metals is worst hit sector on Feb 2
India Steel Market Watch
February 2: It was a bad day for metal stocks as the S&P BSE Metal index plunged 300 points (4.33%) to close at 6,647.17. On February 1, 2016 the market had closed at 6947.69. Today’s high and low points were 6,995.17 and 6,617.52 respectively.
Global markets indices such as CAC, DAX and FTSE as well as the Indian Sensex all closed in the red on February 2. The Sensex lost 285 points (1.15%) to close at 24,539.
Metals was the worst hit sector today. Each and every stock closed in the red. Vedanta was the top loser in this space. The stock crashed 7.8% to Rs 64.90. SAIL, Tata Steel, Jindal Steel, JSW Steel and HINDALCO were also among the losers, down in the range of 3.5-7.8%.
The movement of S&P BSE Metal for the last one year
The price movement of underlying stocks of S&P BSE Metal
|
Company Name |
Last trading |
Change |
%Chg |
Mkt Cap |
|
|
Price |
|
|
(Rs cr) |
|
Coal India |
319 |
-9.6 |
-2.92 |
201492.02 |
|
Hind Zinc |
155.7 |
-4.55 |
-2.84 |
65788.22 |
|
Hindalco |
68.6 |
-2.5 |
-3.52 |
13086.71 |
|
Jindal Steel |
60.15 |
-3.7 |
-5.79 |
5503.15 |
|
JSW Steel |
1004.2 |
-46.6 |
-4.43 |
24273.73 |
|
NALCO |
34.15 |
-0.5 |
-1.44 |
8801.27 |
|
NMDC |
79.4 |
-0.95 |
-1.18 |
31479.85 |
|
SAIL |
39.35 |
-3.35 |
-7.85 |
16253.62 |
|
Tata Steel |
231.5 |
-17.9 |
-7.18 |
22483.64 |
|
Vedanta |
64.9 |
-5.5 |
-7.81 |
17737.68 |